Steven Andrew Parker’s: The Phantom of the Apra
An Exploration of My Submission to the Apra Data Science Now Challenge
First, my apologies to any musical theater fans who were duped by my clever title. I promise if you read til the end, I’ll make it up to you. Secondly, you’re probably wondering “What is Apra?” Well, Webster’s dictionary defines Apra as “the premier organization for professionals who strategically harness information and data to drive fundraising for philanthropic institutions.” Or at least it would if Apra wrote the dictionary. Basically, it’s a great organization that provides tons of resources, knowledge and learning opportunities for pretty much anyone in the fundraising space.
This year, I was happy to be able to participate in Apra’s Data Science Now challenge as a fun way to practice data analysis outside of work. I was even happier to find out that my submission was selected, along with a handful of others, to be featured as part of the 2021 Data Science Now conference. Because my most loyal readers won’t be able to attend the conference (hi mom), I wanted to document my process and share my work here as well. So that’s what you’re reading, right now, lucky you!
2021 Data Science Now Challenge Prompt
You and your team work for a US based non-profit organization that recently conducted a capacity screening on all unassigned prospects in your database. Your team is now at the point of assessing which prospects from the screening should be assigned and to which portfolios they should be assigned.
Your organization is not currently hiring any new gift officers. The fundraising team has 50 portfolio managers with a mix of portfolios that are in development, built out, and perhaps overbuilt.
Your challenge is to identify prospects from the screening to be assigned to a gift officer.
My initial thoughts were that I wanted the portfolios to end up equally sized in terms of both number of prospects and overall capacity value. Complete and exact equality was not the target, but rather I wanted to aim for overall parity among the portfolios. I also anticipated creating sub-groups of portfolios, and having the portfolios be equal within each of those sub-groups, but not necessarily equal across the sub-groups. In a real-world scenario, we’d also have to take into consideration things like gift officer seniority and job roles, both of which can have a heavy influence on what a portfolio looks like. But for this challenge, we can keep it simple and aim for some level of equality and parity.
I broke this challenge up into 6 steps and asked myself a few questions at each step. You can follow along with the dashboards here.
Step 1: Assessing the Current Situation
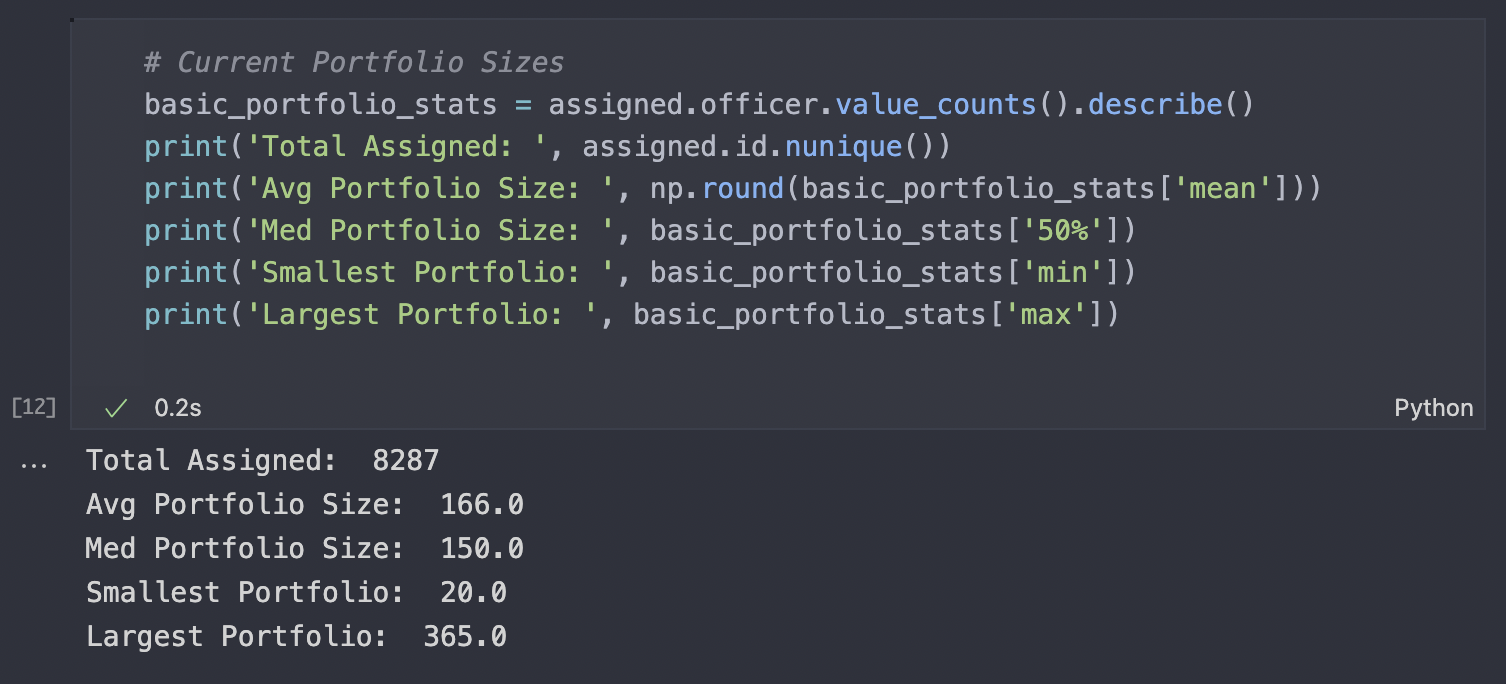
How many prospects are assigned to the 50 portfolios, and how big is each portfolio?
Using python, I loaded the data into a pandas data frame and got started. On average, each portfolio is full of around 150-160 prospects, but there are a few really large and small portfolios. That’s definitely something we need to address as we shoot for a more equal distribution of prospects.
Are all of these prospects being actively cultivated or have any lapsed or been forgotten?
Our dataset also includes information on how often these prospects have been contacted and when they were last contacted. In my experience, it’s very easy for portfolios to become overcrowded with prospects that have not been contacted recently, or sometimes not at all. Are our portfolios full of prospects being actively cultivated, or do we maybe have some folks who have been gathering dust? Let’s find out.

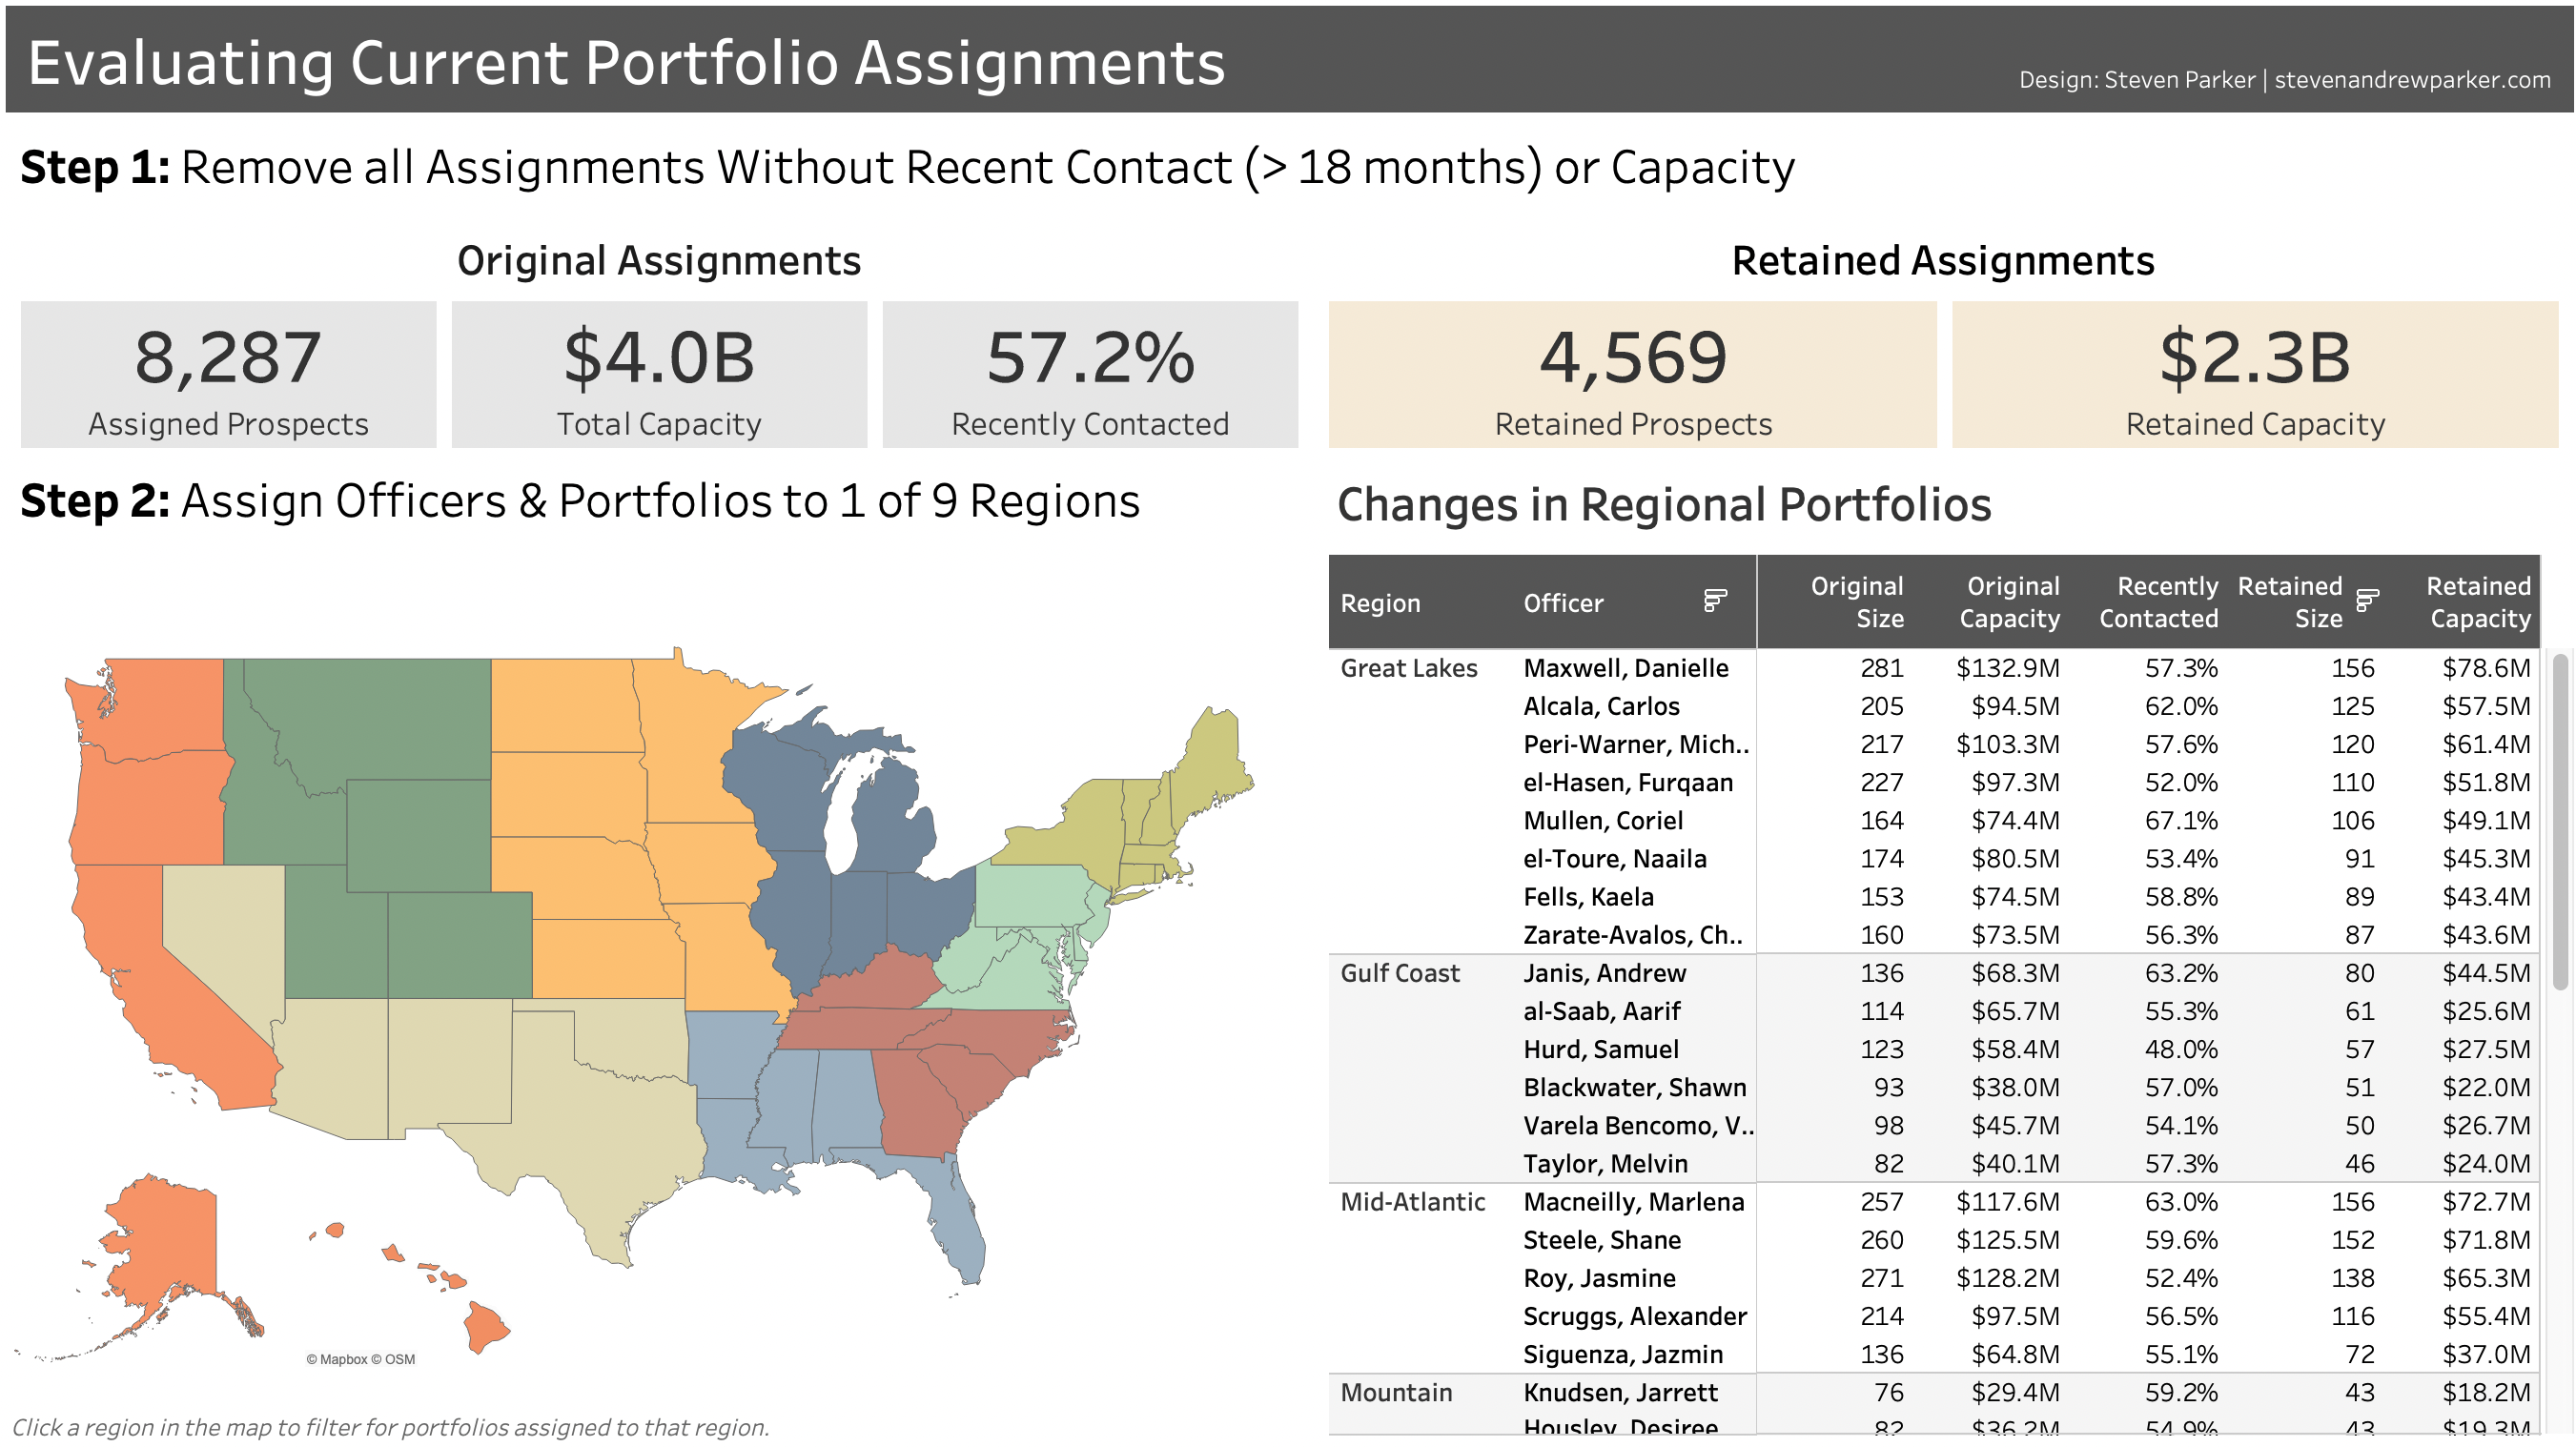
I’m defining “recently” as within the last 18 months, which for this dataset means since March of 2020 (a.k.a. the beginning of “The Dark Ages 2.0”). Of the roughly 8,300 assigned prospects, over 3,500 have either not been contacted recently, or at all. That’s not great news, but it’s good to know.
What does the gift capacity information look like for our assigned population?
There’s no denying that gift capacity is important when discussing fundraising portfolios. However, I will say that relying too heavily on gift capacity can be dangerous. As good as gift capacity calculations and algorithms have become, they are still a very rough approximation of somebody’s wealth based only publicly available information. As a result, I don’t want to focus too heavily on the specific values in the gift capacities, but rather whether they exist at all.
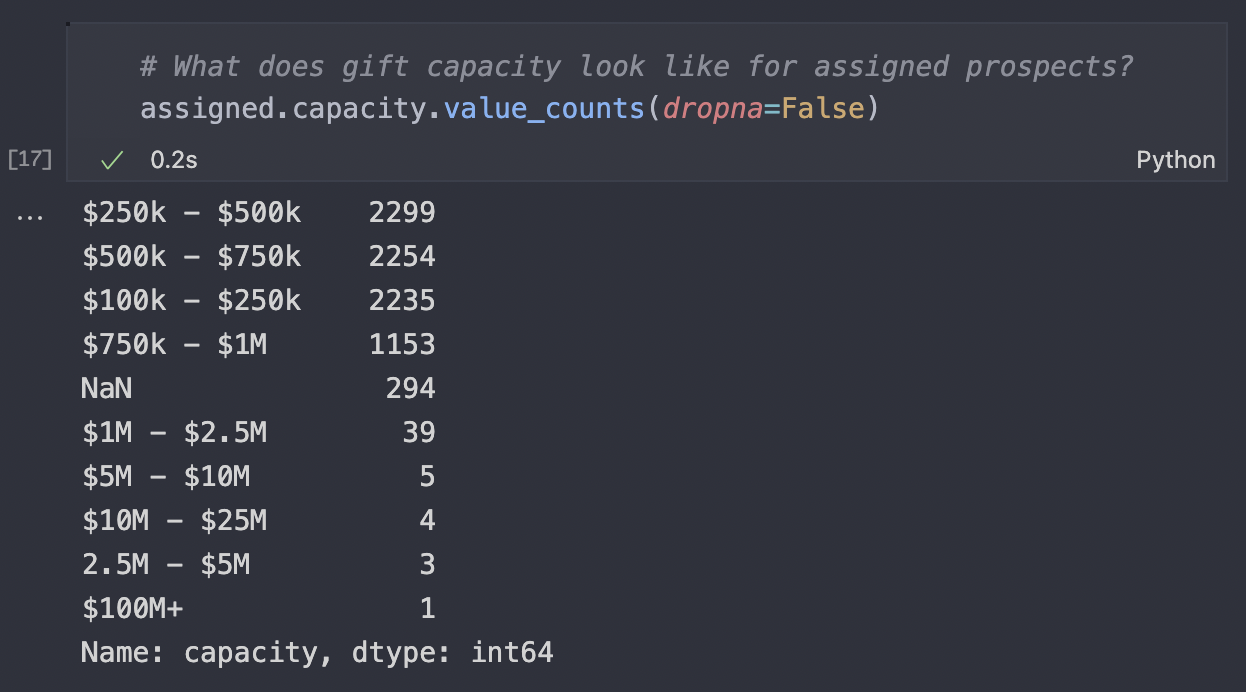
We can see that 294 assigned prospects have no capacity range recorded. This means that they are either unable to be screened, or that their gift officers have not cultivated the relationship enough to be able to provide their own estimate. Either way, these are not great prospects to hold onto.
The other takeaway is that our dataset includes gift capacity ranges which are stored as strings. This format is fine enough for you and I to read and interpret, but not easy for a computer to understand that these ranges represent numeric values. I wrote up a quick pair of functions that first converted each end of the range into its numeric form and then returned the average of those as the specific capacity value. This way I can calculate simple things like the total gift capacity, but remember, don’t get too focused on that single number. It’s just a rough approximation and, in my opinion, is a poor judge of a prospect’s quality. If I learned anything from Ebenezer Scrooge, it’s that a prospects’ actual giving behavior is far more important than their reported gift capacities.
Do we even have space to assign these new prospects into our portfolios?
At this point, I’ll put on my bad-cop hat and remove the assignments for all prospects who have not been contacted recently or who do not have a valid gift capacity. In the real world, this would be a pretty controversial move that would coincide with a major shift in organizational culture. Gift officers are rarely happy to lose prospects and see their portfolio capacity shrink. However, if a gift officer hasn’t contacted a prospect in over 18 months, how can we expect that prospect to make a meaningful gift? If we don’t have a valid gift capacity for a prospect, how can we be sure that we’re cultivating them at the right level? If a prospect is unassigned in the woods, and nobody is around to hear it, were they ever really a prospect to begin with?

After this portfolio slashing, we’re left with a little over 4,500 retained assignments who have a total capacity of about $2.3B (down from $4B). I would argue that these figures represent the true current portfolio statistics, and that the earlier numbers were inflated with non-existent relationships.
Step 2: Assigning Officers and Portfolios into Regions
How am I going to choose 1 portfolio out of 50 possibilities when assigning a new prospect?
Working with 50 individual portfolios seemed too daunting and messy to me, and I needed a way to break up all 50 portfolios into more easily manageable and distinct groupings. With 50 states and 50 officers, my initial thought was to assign one gift officer to each state, but that would quickly ruin my end goal of equally-sized portfolios. For example, California had 1,023 assigned prospects while Vermont had only 19. Additionally, the current portfolio assignments spanned across state lines, and I felt that rebuilding nearly every portfolio to fit neatly within the state boundaries was not really in the spirit of the challenge.
Staying with geographic segmentation, I decided to see if I could neatly split the portfolios into broader regions as opposed to individual states. Because regions in the US are not officially declared, I researched some existing options and liked the regions used by the Bureau of Economic Analysis. This gave me a good starting point and I adjusted their regions slightly based on what I thought would be a better fit for this challenge.
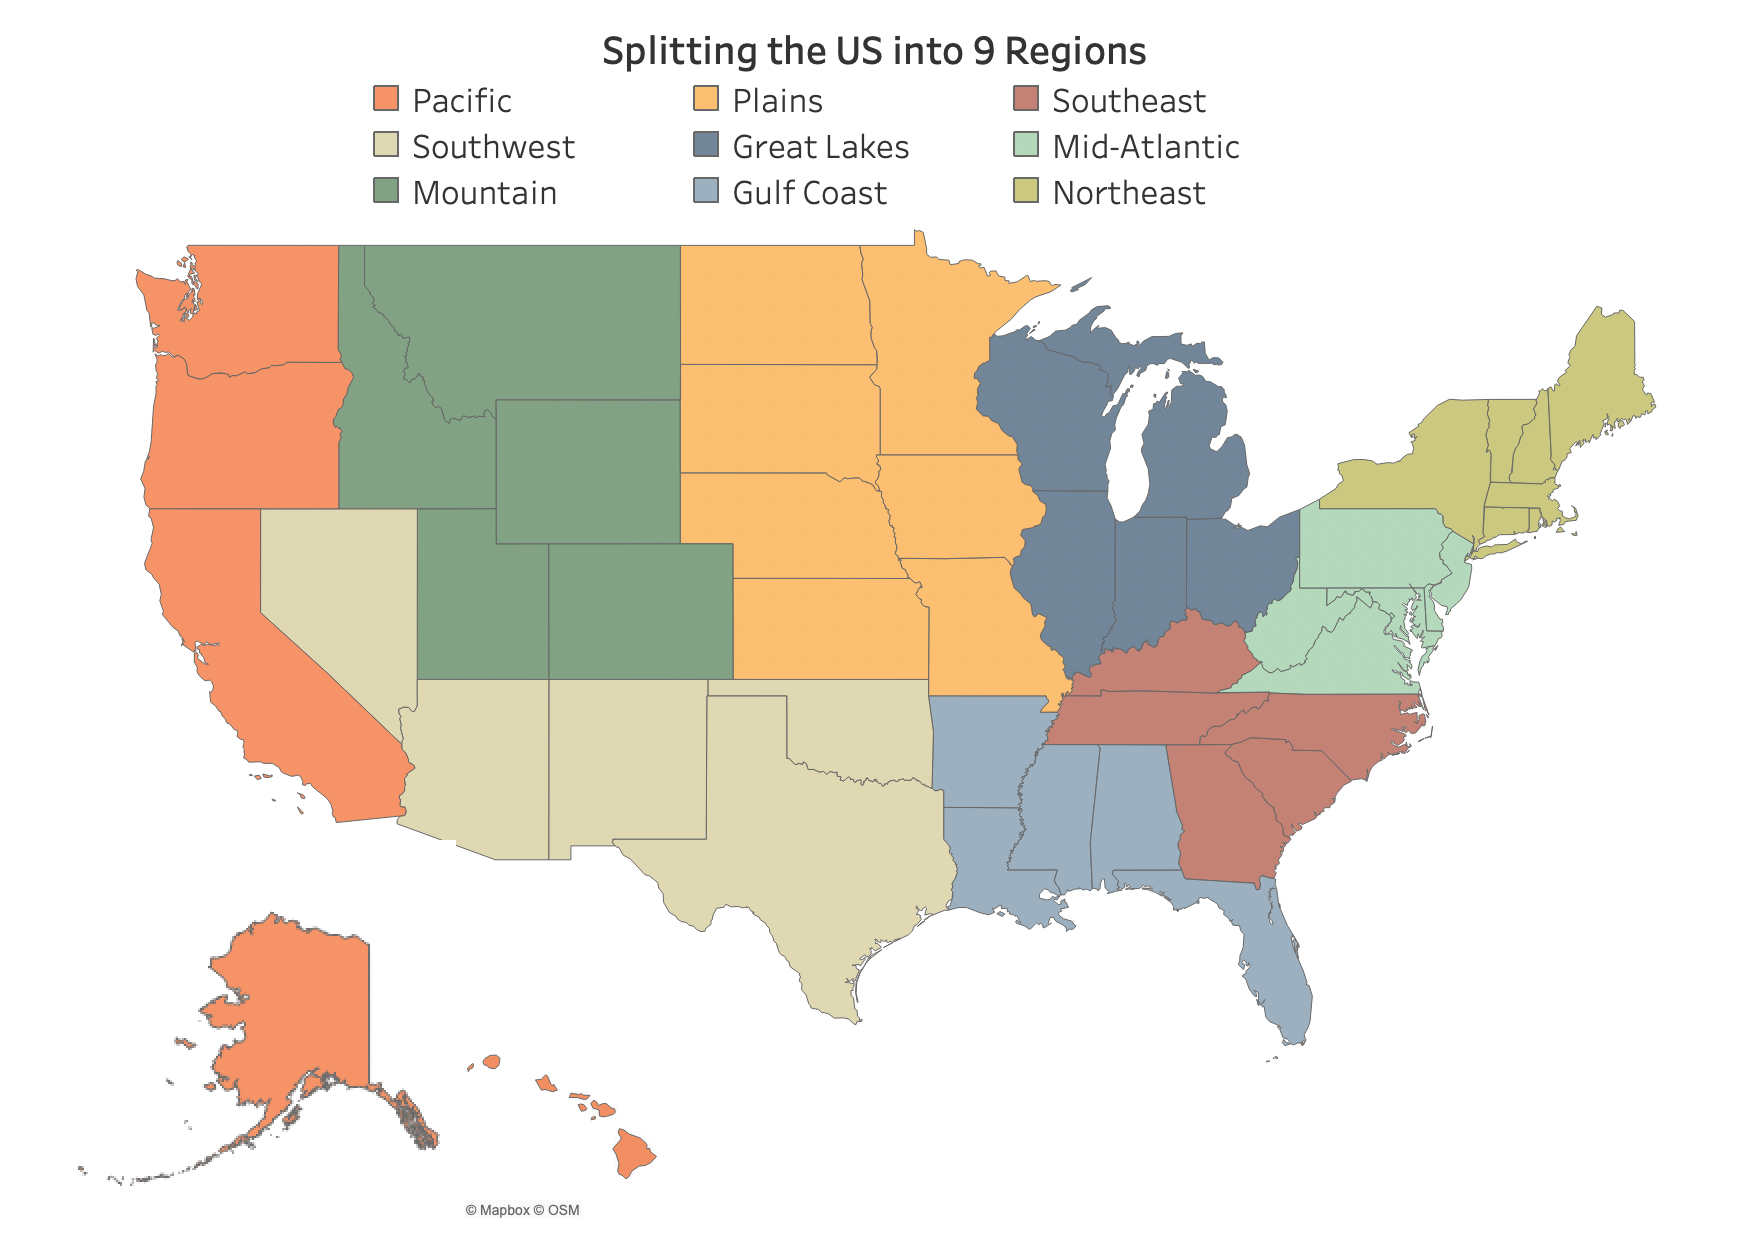
I assigned each gift officer to a “home region” which was chosen based on where the majority of their current assignments lived, and for the most part it lined up very nicely with how the officers’ portfolios already looked. Most officers had at least 70% of their assignments fall into one of my regions, with the remaining prospects in a neighboring region. Not wanting to anger the gift officers any further, and to keep some semblance of realism in the challenge, I decided not to remove any remaining assignments that fell outside of the officer’s home region.
However, any future assignments would only be made from within a gift officer’s home region. For example, if an officer’s home region is the Pacific, they would be allowed to keep their retained prospects who may live all across the country, but all future prospects assigned to that officer would have to come from one of the 5 Pacific states (Alaska, California, Hawaii, Oregon or Washington).
Step 3: Calculating the Target Portfolio Size
How many new prospects should I assign for each region? Is there ever such thing as too many prospects?
Creating the regions gave me a good start on knowing where to assign new prospects, but I still needed a way to decide on the specific portfolio within the appropriate region to send a new prospect to. This process begins with what I called the “Target Portfolio Size”.
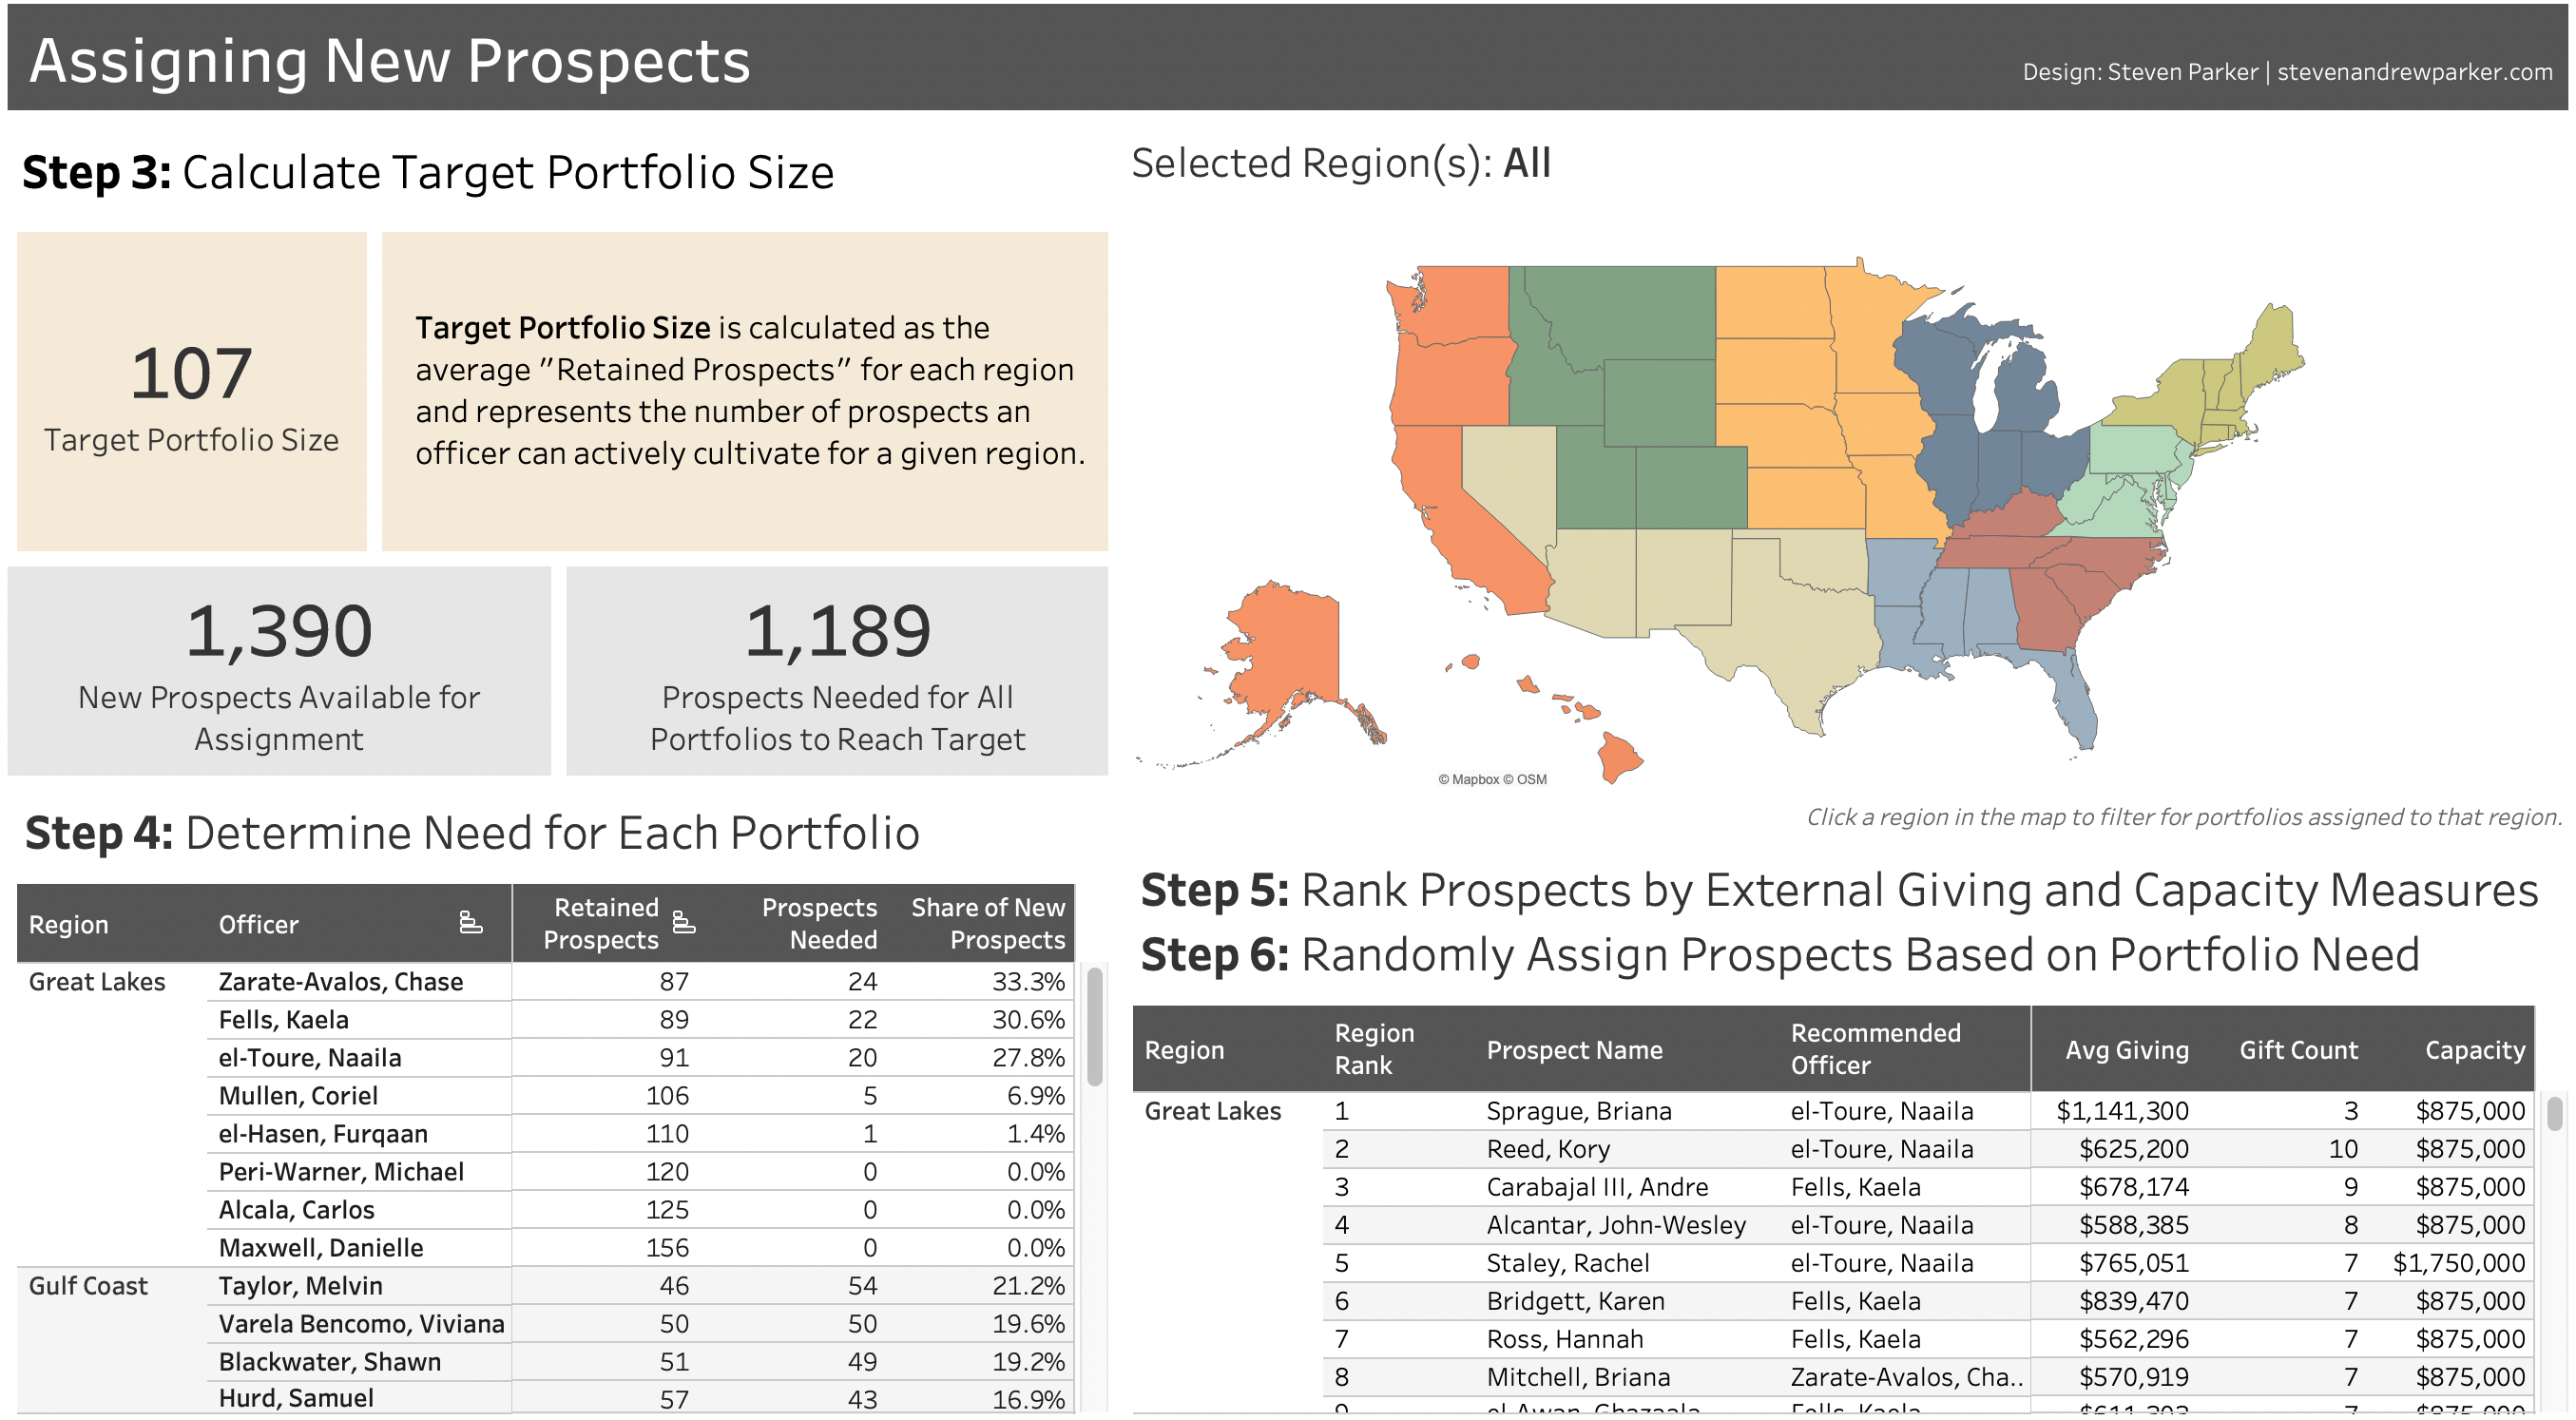
The Target Portfolio Size is simply calculated as the average of the retained portfolio sizes for each region. This value represents the number of prospects that we can expect the gift officers from any given region to be able to actively cultivate. Based on the value for the entire country (107) I decided to set a minimum value of 100 for this. Essentially, based on the national average, all gift officers should be expected to be able to handle at least 100 prospects at a given time. Some officers may be expected to handle more depending on the region, the Northeast has a Target Portfolio Size of 125 for example. I like this approach for determining portfolio size because it’s based on the actual demonstrated behaviors of the gift officers, and we can feel confident that our portfolios are sized to match our officers’ abilities.
Step 4: Determining the Portfolio Need
Does everyone get new prospects? How do we know how many new prospects to assign to each portfolio?
Each portfolio in a region can now be compared to the regional target to determine whether they will be accepting new prospect assignments or not. Those which are already at or above the target will not be receiving new assignments, while those below the target will receive as many prospects as needed until they reach the Target Portfolio Size. This is referred to as the Portfolio Need.
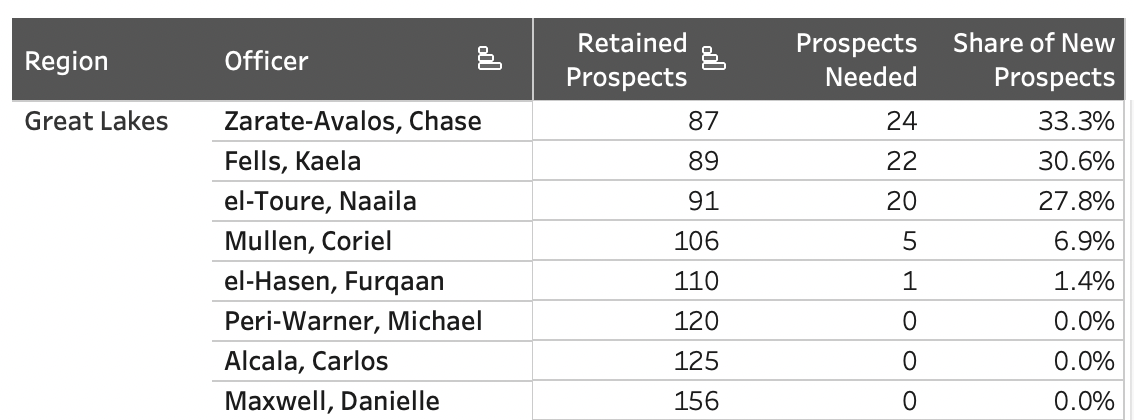
When we add up the Portfolio Need for a whole region, we’re able to use that total to calculate the share of new prospects that should be assigned to each portfolio. Essentially, each portfolio will be entitled to a certain share of all the new prospects for their region, and that share will be based on their portfolio need. For example, if my entire region needs a total of 100 new prospects for all of our portfolios to reach the target size, and my specific portfolio needs 60 new prospects to reach the target, my share of the new prospects being assigned should be 60%. Another officer who only needs 10 new prospects to reach the target, should receive 10% of the new prospects being assigned.
Step 5: Ranking the New Prospects
Can we assign everyone? If we can’t assign everyone, how do we prioritize our new prospects? What makes a “good” prospect?
For some regions, the overall Portfolio Need is greater than the number of new prospects we have available. The Mountain region for example would need 176 new prospects for all its portfolios to reach target size. However, we only have 43 new prospects available in the region. In this case, every new prospect will end up being assigned. But for the regions that have a surplus of new prospects, we need a way to rank and prioritize so that we’re assigning the best prospects available.
When I think about what makes a good prospect, I want somebody who makes large gifts frequently and will continue to do so. Following this logic, I ranked the new prospects based on their average gift size, the number of gifts they’ve made, and finally their capacity. I feel that this will elevate and prioritize prospects who have the most potential to make significant impact with their giving. Again, you’ll see that I’m prioritizing the prospect’s actual giving behavior ahead of their reported capacity values.
Step 6: Assigning New Prospects Based on Portfolio Need
How do we know which specific portfolio to assign a new prospect to?
Let’s take stock of what we have done so far:
- We freed up spots in the portfolios by removing old and meaningless assignments
- We grouped portfolios into geographic regions which has given us a rough idea of where new prospects will end up
- We know how many new assignments are needed for each region and each portfolio to be considered “full”
- We know which new prospects are the best and which should be assigned first
All that’s left is to choose into which specific portfolios to assign our new prospects. We need a way to make those assignments fairly and easily. The answer: randomness! A random approach will allow for a naturally even distribution of prospect quality and will avoid any potential biases we may introduce if we were to select by hand or follow a set order.
But, if we’re assigning prospects to portfolios at random, how do we make sure that we end up with roughly equal portfolios at the end? We can adjust the probabilities of each portfolio being chosen based on the share of new prospects they’re entitled to. Luckily, we calculated that back in Step 4. Now all that’s left is to make those random assignments until we either run out of new prospects for a region, or until we fill all portfolios to the target size. In the latter scenario, the leftover prospects will remain unassigned until spots open up in the portfolios. That way, there is a pool of prospects that is ranked, sorted, and ready to go as the gift officers work through their portfolios and eventually need more prospects.
What Are the Results of Our Changes?
Did we make things better?
I think we made things better, obvs. But don’t just take my word for it. Let’s look at how the portfolios have changed:
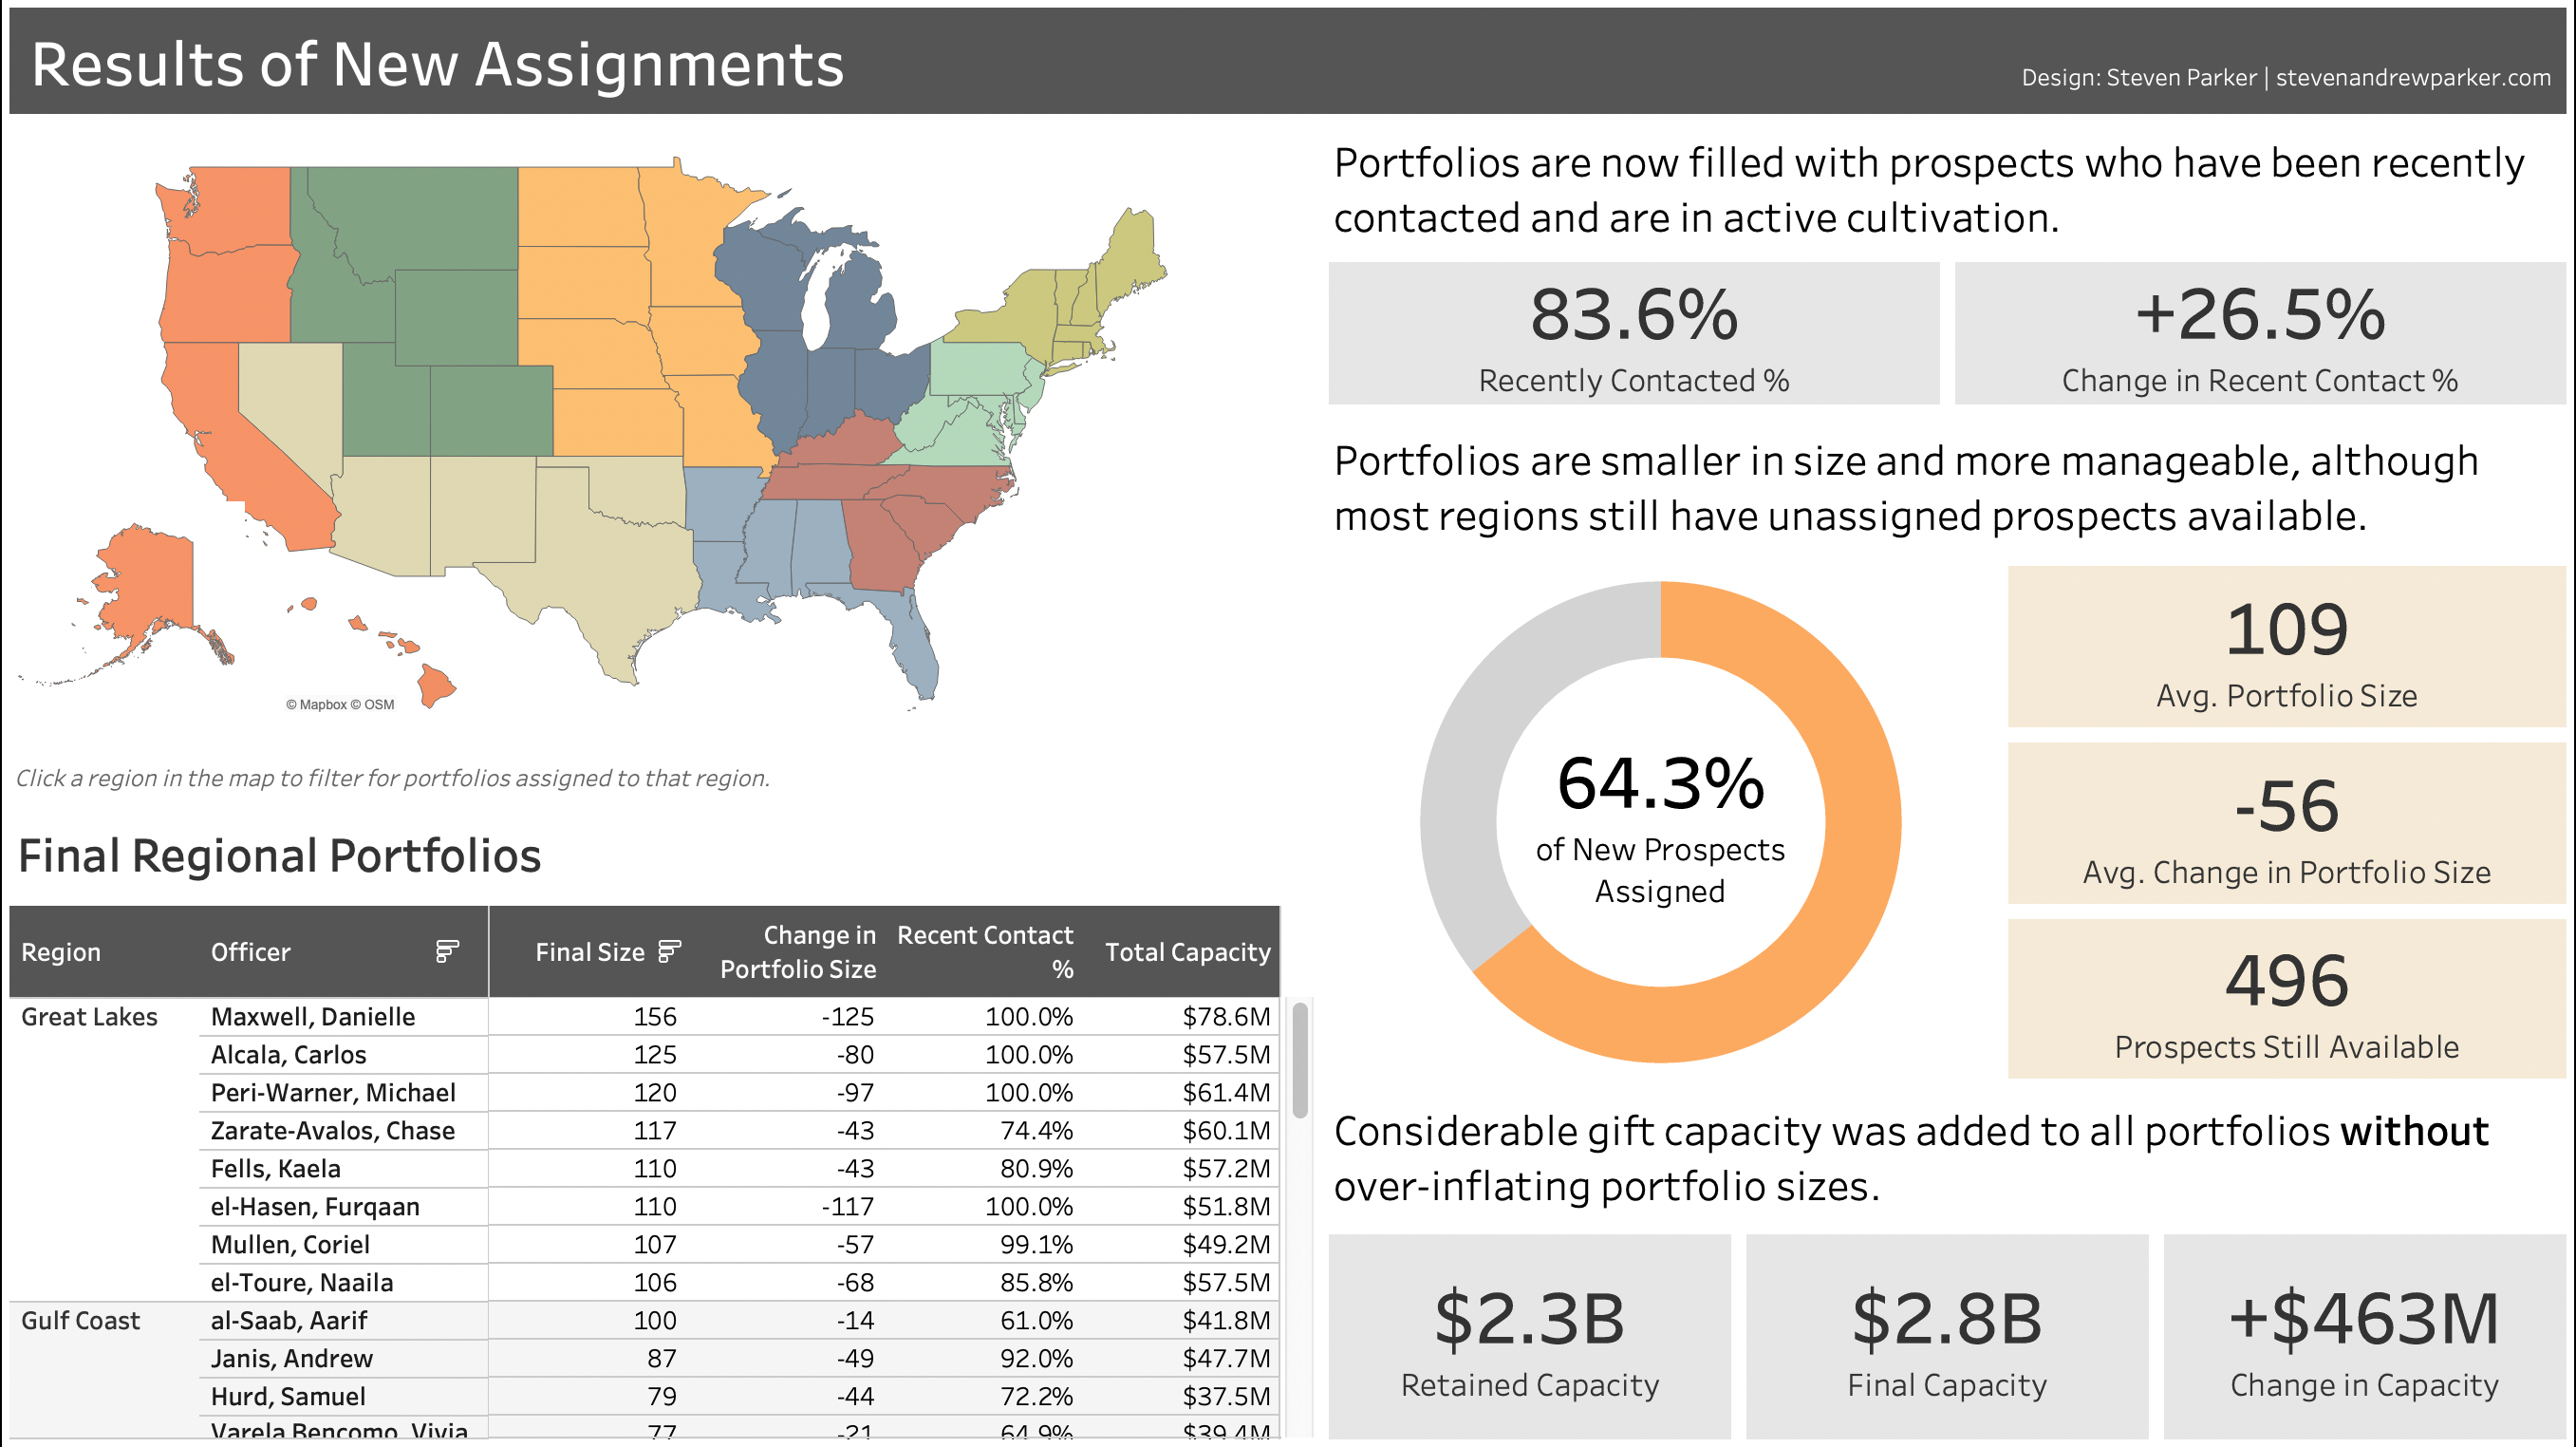
- When we started, less than 60% of assigned prospects had been contacted recently, if at all. Now that number is over 80%, and the only reason it’s not higher is because we just made a bunch of brand new assignments. If the organization maintains a strict 18 month time limit for contacting prospects, we could reasonably expect that recently contacted number to climb closer to 100% as time goes on.
- Our portfolio sizes are smaller, down 56 on average across the country. But this reduction in size was purposeful and dictated by the gift officers’ behavior. I feel that these smaller portfolios are more manageable and will prevent prospects being ignored or forgotten. Additionally, keeping active portfolios smaller allows the organization to remain flexible in terms of the remaining unassigned prospects. It’s very difficult to reassign a prospect from one officer to another, so keeping the unassigned pools more full gives everyone a chance at quality prospects whenever they are able to take them on.
- Lastly, let’s talk about gift capacity. For as much as I’ve besmirched the reputation of gift capacity ratings, they are undoubtedly important to a lot of people, particularly gift officers and those in leadership. While our overall gift capacity has gone down significantly from the original assignments, I would argue that we were able to add a considerable amount of capacity (nearly $500 million nationwide) without overfilling our portfolios. Our approach enabled us to increase overall gift capacity while still maintaining a realistic and manageable number of assigned prospects.
So, yeah. I’d say we made things better. I’d like to thank Apra for putting on the Data Science Now conference and hosting this fun challenge! I’d also like to thank you, dear reader for making all the way to the end of this post. As promised, here’s something for all you musical theater nerds.
