A Pool Party in February? What a Super Idea!

An Analysis of Super Bowl Pool Numbers

The Super Bowl is this weekend. That means hot wings, Clydesdale commercials, and gambling in Super Bowl pools. My wife’s family does one of these pools every year. For the uninitiated, there are plenty of places to learn this game online. In short, there is a 10×10 grid with each row and column having an assigned digit of 0-9. Everyone playing is randomly assigned a square whose row and column numbers become your digits. If my square is in row 6 and column 4, my digit pair is (6,4).* At the end of each quarter, the last digit of each teams’ score is used to determine the winner for that quarter. For example, if the score was 14-3 after the first quarter, whoever ended up with the pair (4,3) would win some money.

*There is no hard/fast rule about which team is assigned to the rows and which to the columns. So for the sake of simplicity I’m going to consider corresponding digit pairs collectively. Or, put in a way that humans actually speak, “For the purposes of this dumb blog post, the (0,7) pairing and the (7,0) pairing are the same, and I’m just going to talk about them together as a single concept.”
 
Because the digit pairs are randomly assigned, you have an equally likely chance of ending up with any pair. But do all the pairs have an equally likely chance of paying out? Join me as I investigate this crucial, never-before-answered question, and procrastinate on things like cleaning the house, making dinner, 0r paying bills.
 

My Methodology

I used sports-reference.com’s free python API to collect the scoring breakdown by quarter for every game in the past 20 years. That came out to 5,359 games. I figure this sample size should be more than enough for what we could expect from the Super Bowl. After cleaning and manipulating the data, what I ended up with was a list of the cumulative quarterly scores for both teams for all 5,359 games. From there, I could just extract the last digit from each score, and we’re off to the races.
 

Behind Bars

I know that there are some people who would love to look through a 5,000-row spreadsheet, and try to remember what numbers they see most often. But it’s 2022, and there’s a new sensation sweeping the data analysis nation: the Bar Chart! The humble bar chart will make our investigation much easier. When we break the data up by quarters and plot the frequency of the scores, we can see right away that certain numbers come up a lot more often than others.
A Pool Party in February? What a Super Idea!
Clearly, you stand a better chance of winning money if you have a 0, 7, or a 3 in your pair. Duh! Football scoring starts at 0, and (mostly) increases in increments of 7 (touchdowns) and 3 (field goals). And if the team scores a touchdown and a field goal, you’re back to 0 (7 + 3 = 10).
 
As the game progresses, other numbers start to become more valuable; 4, 6, and 1 come into the picture. Again, this makes sense; two touchdowns gets you a 4 (7 * 2 = 14), three of them gives you a 1 (7 * 3 = 21), and two field goals brings you to 6 (3 * 2 = 6). If you have 0, 7 or 3, you’re still in the best shape, but more people stand a chance to win money as the game continues and these new score digits become more common.
 
Then we have what I like to call the “dud digits”: 2, 5, 8, and 9. They are incredibly rare in the beginning, and don’t really improve much later in the game. That’s to be expected, it’s hard to get to these values with the way football scoring works. Technically, there is something called a safety which results in 2 points, and a team may go for a 2-point conversion after a touchdown to reach 8. But those events are rare, and so the owners of squares with these digits are left clinging to the faint hope that some complex combinations of 3s and 7s will land them some money.
 

Let’s Crank up the Heat

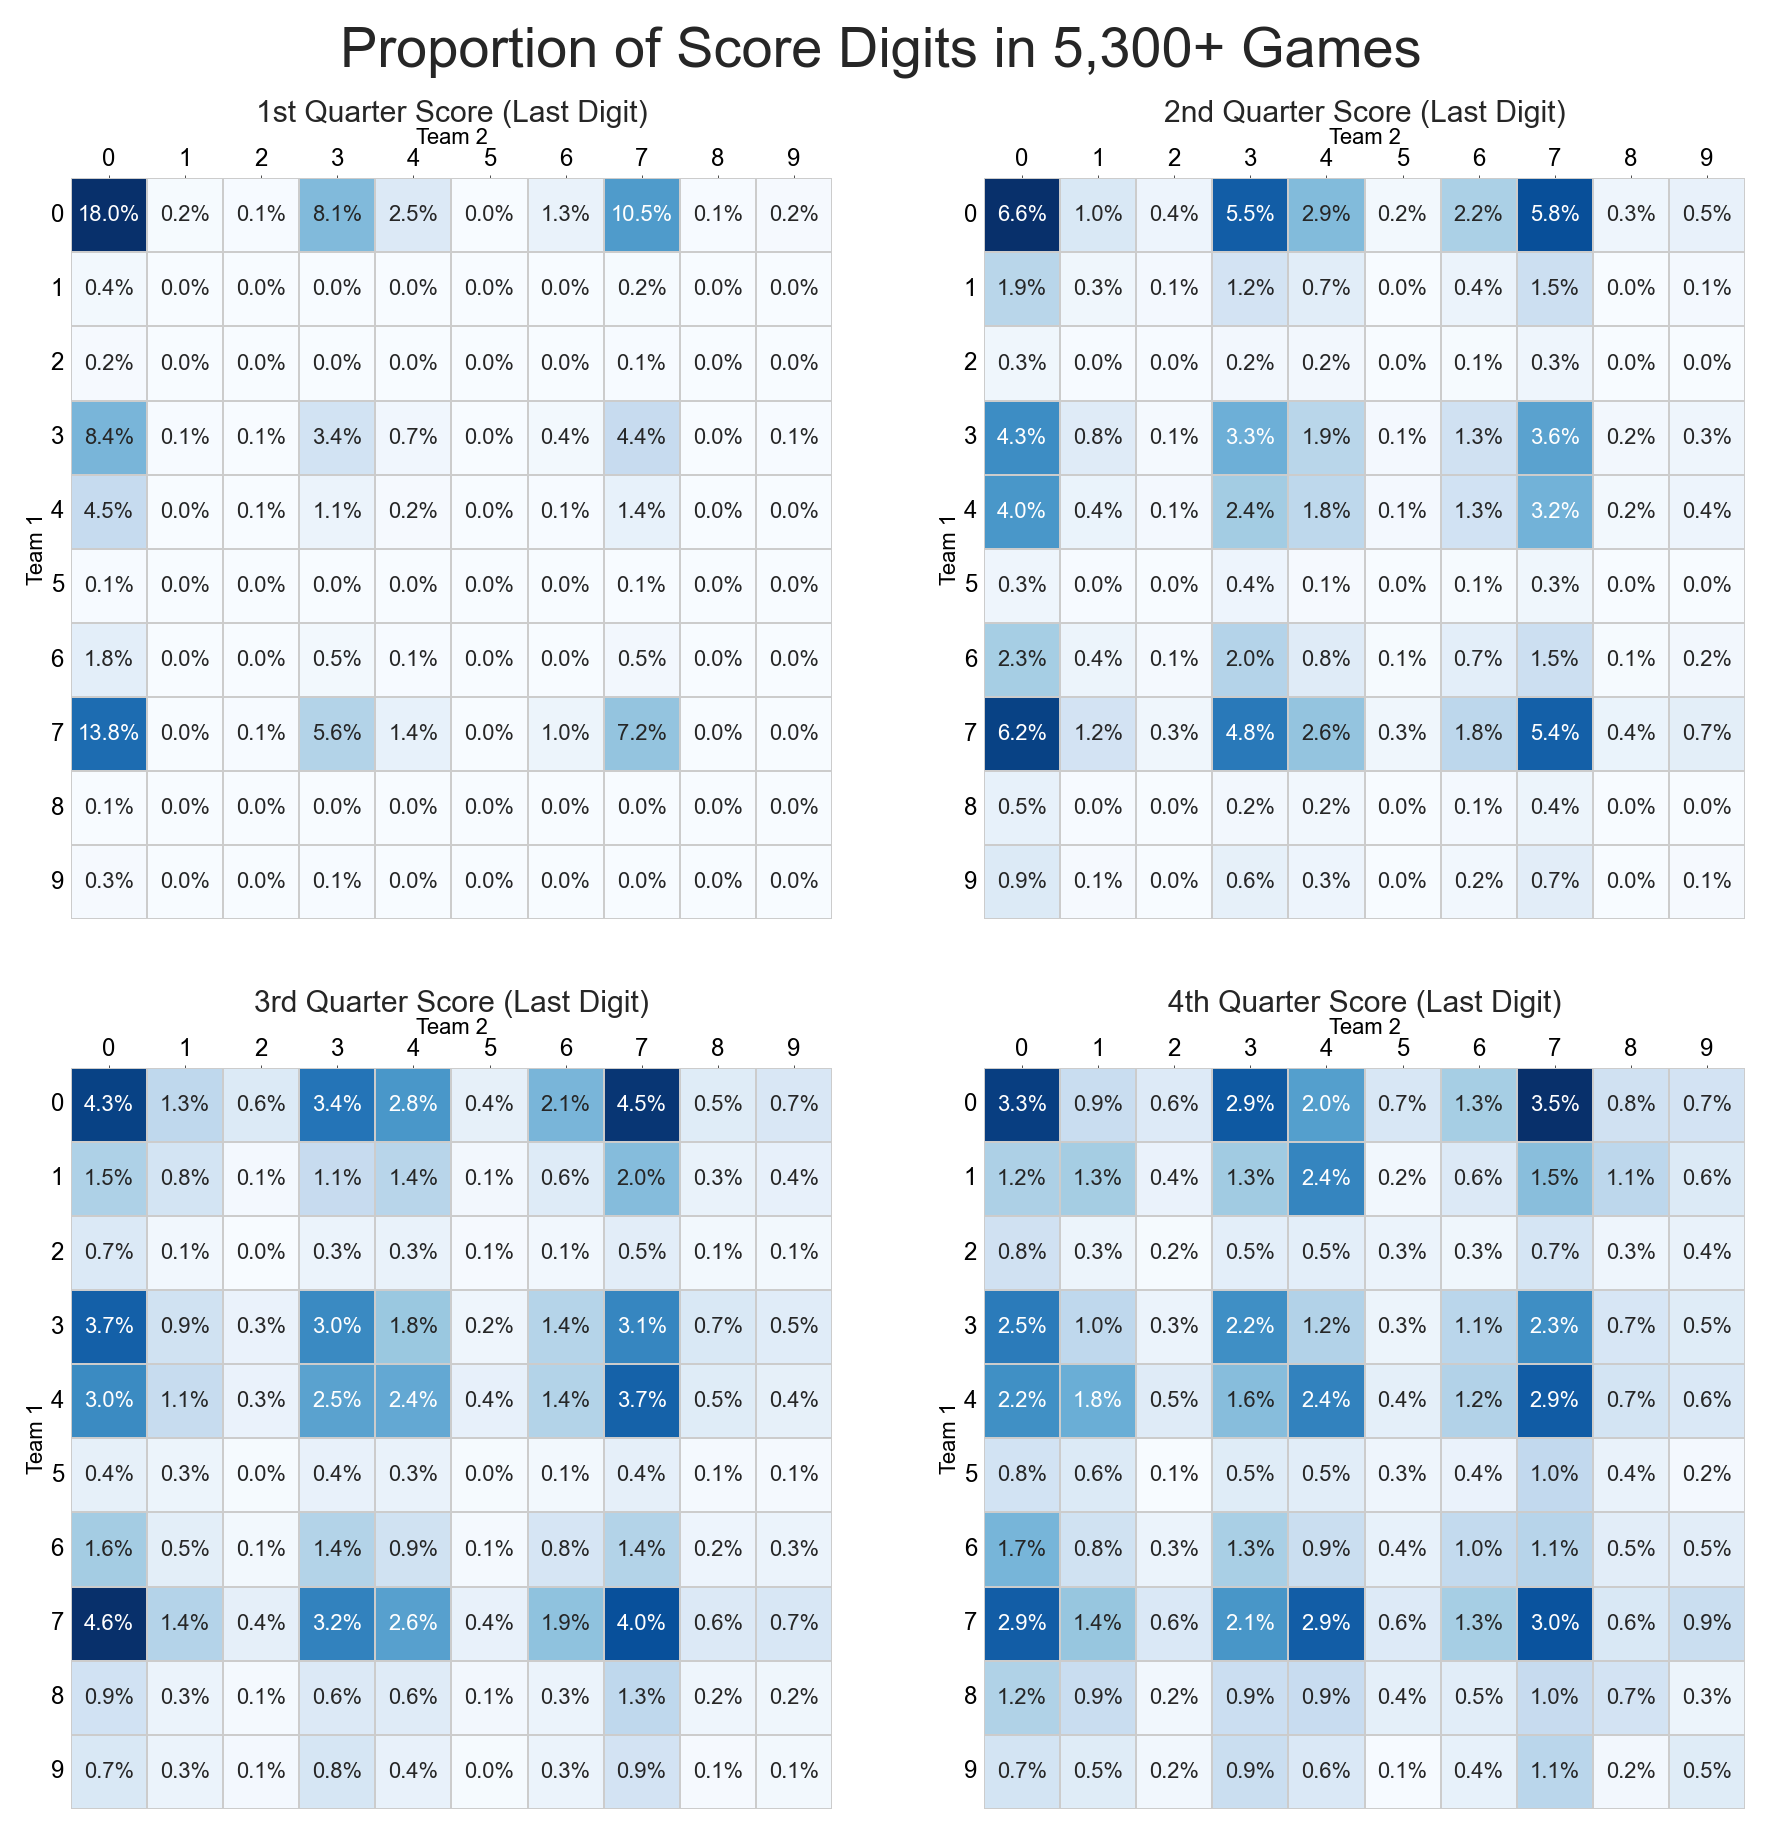
The bar charts are nice and simple, and give us a good overview, but they don’t match up with the actual grid that people play with. We also can’t really tell how good or bad any specific digit pair is based on our historical data. All we can see is that some digits are better than others. Our old pal the heat map is perfect for the job of diving deeper.
 
a grid of heat maps showing digit percentages
The heat maps are formatted just like the grid of the Super Bowl pool. Inside each square, we have the percentage of our 5,300+ games whose quarters ended with that digit pair. And in true heat map fashion, the darker the square, the more often that digit pair came up. We can clearly see hot spots at the intersections of 0, 7 and 3 at the start of the game, and those squares stay the darkest throughout the whole game.
 
If we add up the percentages, we can truly get a good understanding for how valuable the 0 and 7 pairings are, especially early in the game. Nearly 50% of all 5,359 games ended their first quarter with some pairing of 0s and 7s. If history is to be repeated, and you have some variation of 0 and 7 in your pool, you’ve got about a 50% chance of making money after the first quarter on Sunday. Lucky you!
 
Just like with the bar charts, we can see some of the 3, 4, 6, and 1 squares becoming darker as the game continues. Overall, the percentages even out considerably by the fourth quarter. In the first quarter, the best square won around 18% of the time, but by the end of the game, the best squares are winning around 3% of the time. So it would seem like the playing field has become much more level, right?
 
Not necessarily. The best squares are still the 0s and 7s, followed closely by 3s and 4s, and then the 6s and 1s. Did you notice what squares never really seem to get dark? Yup, our old friends 2, 5, 8 and 9. To be fair, the 8 and 9 squares have some color by the fourth quarter, and some of the squares pairs even break a 1% success rate!!! But the 2 and 5 squares are about as pale as a certain data analyst with a blog he updates sporadically. If we look back to the bar charts, we can see that 2 and 5 are essentially the worst digits to have in a pairing. They have a lower frequency than nearly every other digit for pretty much the entirety of any game. So even if one of your digits is a valuable 7 or 0, if the other is a 2 or 5 , your chances drop considerably!
 
Shall we really dive in to the misery of 2 and 5? What happens if you have both a 2 and a 5? What if you were very bad in a past life and your digit pair is either (2,5) or (5,2)? If that’s your situation, you’re looking at somewhere between a 0.1% – 0.4% chance of making any money at all for the entire game. Over all four quarters, those pairings have been successful less than half a percent of the time! Your best case scenario for a 2 and 5 pairing means you have a 99.6% chance of losing.
 

My Super Bowl Pool Plans

I mentioned that my wife’s family does one of these Super Bowl pools every year. Would you like to guess what my digit pair is this year? Let’s just say that there’s a 99.6% chance I’ll be watching the game for the commercials.