How Healthy is Your Donor Population?
An Analysis of Retention, Reactivation, Acquisition, and Loss
Let’s do a visualization exercise. You can keep your eyes open or close them, dealer’s choice. But I want you to imagine that you’re in charge of a local nonprofit. Maybe you run an organization that seeks to reunite people with socks they lost in the laundry. Or maybe you’re leading the charge to have comic sans be the Official Typeface of the Internet. Whatever your organization does, you’ll need to know the answers to some important questions in order to accomplish your noble mission. Is your organization getting stronger or weaker? Are you bringing in more donors than you used to? What happens after somebody makes a gift? Do they give again? To put it simply, how healthy is your donor population? Looking at the health of your donor population can give you an idea about whether you are on the right track, or if you need to re-strategize before all your donors, and their dollars, are gone.
You can begin to analyze the overall health of your donor population by calculating 4 numbers: Retention, Reactivation, Acquisition, and Loss. I call these the “Big 4” because they are the key ingredients in understanding the health of a donor population.
The Big 4
- Retention: How many of last year’s donors have given this year?
- Reactivation: How many donors who last gave at least 2 years ago and did not give last year, have given this year?
- Acquisition: How many brand new donors have we brought on this year?
- Loss: How many of last year’s donors have not given this year?
Case Study: Wossamotta University
Let’s take a look at the health of the donor population at Wossamotta University* (Wossamotta U for short). The university leadership wants to know if they’re going in the right direction, if their donor population is getting stronger, and if there’s anything they can do to improve. This analysis will help them get those answers.
*Wossamotta U is a fictional university whose most notable alumni are Rocky the Flying Squirrel and Bullwinkle J. Moose. As such, the data shown here is fictional, randomly generated and modeled to simulate real-world giving data.
The first step is to gauge if the donor population is growing or shrinking using our Big 4. To do this, we simply add up the retention, reactivation, and acquisition numbers to get our donor count for the year. If the donor count is larger than the loss number, then your donor population grew that year. Consistent growth is likely a sign that your organization is getting stronger. If your loss number is bigger, your donor population shrank that year. Consistent shrinking means that your fundraising strategies are not working, and you may need to reassess your approach before your fundraising efforts cost you more than they generate.

When we look at the last 20 years of Wossamotta U’s giving data, we see that they have shown consistent, year-over-year growth. Every year, the donor count outnumbers the loss count. The donor population is growing, so the university must be doing just fine. Case closed, end of blog post…right?
Not quite, we need to explore the data further.
Exploring Deeper
It’s crucial to understand why and how the university is growing in order to understand whether such growth is sustainable or if we’re heading for trouble. Additionally, we’ll be able to identify if there are ways to maximize the growth and improve the overall health of the donor population. Let’s look at Wossamotta U’s Big 4 from the last five years. What are the takeaways from the Big 4?
- Donor loss seems like a problem area for the university
- Each year, Wossamotta U fails to retain nearly 12,000 donors who gave the year before.
- The reactivation population is the smallest subset of donors
- This makes sense, because it’s generally more difficult to reactivate donors after multiple years of no giving, but we’ll explore this later in the post.
- Acquisition is critical for Wossamotta U to maintain this growth
- The university averaged 19,000 donors each year, and over 10,000 of those were first-time donors (54%). Around 30% of those donors were retained from the prior year, and the remaining were reactivated from several years ago.

In 2019, the university acquired nearly 14,000 donors who represented nearly 60% of all 24,000 donors that year. Clearly, the acquisition efforts are paying off for Wossamotta U! But what happens to those acquired donors after they’ve been brought on? We already know from our Big 4 that the university has been losing 12,000 donors each year. That’s not very promising, but let’s dig deeper into our retention and reactivation numbers to understand exactly what’s going on. I like to use “recaptured” as an all-encompassing term for these donors. Recaptured donors have given at some point in the past, either in the prior year or many years ago, and have been retained or reactivated in the current year.

Retention
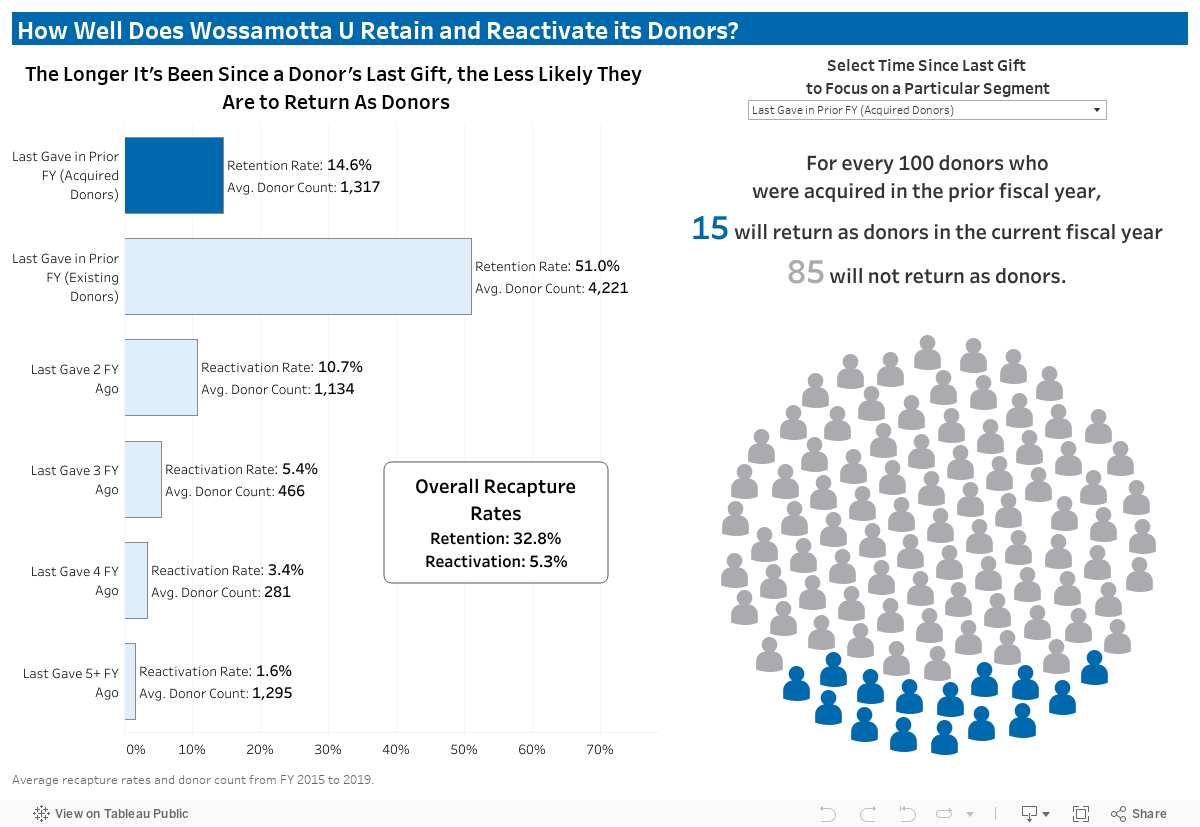
First, we’ll explore retention. As a refresher, retention is a measure of how many donors from the prior year, give again in the current year. There are two types of donors who can be retained: donors who were acquired in the prior year, and existing donors who were recaptured in the prior year. Here are the retention rates for these two types of donors over the past five years. Retention rates are simply your retention number divided by the prior year’s donor count as a percentage.

Donors who were acquired in the prior year are only retained at 14.6% at Wossamotta U, and on average that amounts to roughly 1,300 donors acquired in the previous year, and retained in the current year. If we look specifically at 2019, the university acquired nearly 14,000 donors. A 14.6% retention rate for acquired donors means that only 2,000 of those donors will give again in 2020, and the remaining 12,000 will be lost. Yikes!
The retention rate for existing donors is significantly higher at 51%, which typically amounts to 4,000 donors. For 2019, Wossamotta U had nearly 10,000 recaptured donors. This retention rate for existing donors would mean that about 5,000 of those donors would give again in 2020, and 5,000 would not. On some level, this difference between acquired and existing retention rates is to be expected. The acquired donor population will include people who are simply making one-time gifts and who are not beginning a philanthropic relationship with the university. The existing donor population is made up of folks who already have some relationship with the university. In the existing donor population are going to be your most loyal donors who consistently make gifts.
Combining both acquired and existing retention numbers gives us our overall retention rate: 32.8%. Wossamotta U only retains about 1/3 of its donors from one year to the next. Looking again at 2019, of the 24,000 donors, somewhere around 7,000 will give again in 2020, and 17,000 will be lost. Double yikes! Some of those 17,000 will come back as donors in future years, but to estimate that we’ll need to look into reactivation.
Reactivation
Again, as a quick refresher, reactivation is a measure of how many donors, whose last gift was at least 2 years ago, have given in the current year. Reactivation rates are calculated just like retention rates; they’re just your reactivation number as a percentage of all donors who could be reactivated. Here are the reactivation rates for Wossamotta U over the past five years.
Because reactivation includes all donors whose last gift happened sometime between 2 years ago and the dawn of man, it is helpful to split it into groups. How you split up reactivation will vary by organization and some natural groupings should occur when you look at reactivation rates on a yearly basis. For Wossamotta U, I chose to create four groups based on how many years it has been since a donor’s last gift: 2 years ago, 3 years ago, 4 years ago, and 5 or more years ago.
Right away, we see that the longer it has been since a donor’s last gift to Wossamotta U, the less likely they are to give again in the current year. The rates range from about 11% of donors who last gave 2 years ago down to 2% for donors who last gave 5 or more years ago. For each year removed from the last gift, reactivation rates drop off.

Remember those 17,000 donors who gave in 2019, but wouldn’t be retained in 2020? Using these reactivation rates, we can calculate how many donors will return over the next few years.
- In 2021, there will be 17,000 constituents who were not retained in 2020 and whose last gift came in 2019. Of those constituents, 1,819 (10.7%) will be reactivated that year.
- By 2022, there will be 15,181 constituents whose last gift came 3 years earlier in 2019 (17,000 – 1,819). Of those constituents, 820 (5.4%) will be reactivated that year.
- By 2023, there will be 14,361 constituents whose last gift came 4 years earlier in 2019 (15,181 – 820). Of those constituents, 489 (3.4%) will be reactivated that year.
- By 2024, there will be 13,872 constituents whose last gift came in 5 years earlier in 2019 (14,361 – 489). Of those constituents, only 222 (1.6%) will be ever reactivated either in that year or at some point in the future.
Adding those up, we find that only 3,350 out of the 17,000 will ever give to Wossamotta U again. To calculate the overall reactivation rate, we can average the rates for each year, and we end up with 5.3%. That means in any given year, Wossamotta U can expect to retain 33% of the donors from the prior year and to reactivate 5% of all former donors who did not give in the prior year.
It’s natural for reactivation rates to be lower than retention rates. Human beings are creatures of habit, and once something falls out of our routine, it becomes harder and harder to start doing it again (see all my New Year’s resolutions that were abandoned by the end of February). Additionally, the population that is eligible to be reactivated is incredibly large as it contains all the donors who have ever given to Wossamotta U, and then stopped giving.
The Verdict & Recommendations
So what do we tell the leadership at Wossamotta U when they ask if their donor population is healthy? And what recommendations can we make to help improve the health even further?
First, we give them the good news. Their donor population is growing steadily, and their acquisition efforts have been bringing in over 10,000 new donors every year. That’s been a major success for them, and I would recommend they shouldn’t mess with it too much.
Now, time for the bad news. They’re losing about 67% of their donors from one year to the next and are then only able to reactivate 5% of those lost donors. The current fundraising strategy is so heavily reliant on an annual influx of new donors which puts the university in a very precarious position financially. If acquisition efforts falter, or if something were to come along and severely disrupt the economy and philanthropic giving, like a global pandemic for instance, Wossamotta U may not have a strong enough foundation of returning donors to weather the storm. Fundraising at the university seems like a revolving door. Thousands of donors walk in and then immediately walk right back out.
So what is the leadership of a fictional cartoon university to do? I would recommend that they prioritize donor retention over the next couple of years. You can select different times from the drop-down menu below to understand why:
Imagine, in a pandemic-free world, that we take a trip to Las Vegas. There are 6 slot machines in front of you and a sign listing following probabilities of hitting a jackpot on each machine:

If you have to put something into each of the machines, which one would get most of your money? How much money would you put into machines 4, 5 and 6? This is how I would advise Wossamotta U think of its retention and reactivation efforts, as slot machines with different odds of winning. I recommend that leadership reallocate some of the resources away from reactivation and move them to boosting retention efforts. Improving retention will make a much bigger impact to the donor population health than focusing on reactivation. More money spent on retention should yield more donors and dollars on a yearly basis. The wins from investing in reactivation are just too small. In a future project, I’ll explore the actual costs of some retention, reactivation and acquisition mailings at Wossamotta U. Until then, here’s a quick spoiler: It’s more cost-effective to solicit donors for retention than to solicit donors for reactivation.
Retention may not be the “one metric to rule them all”, but it can be an incredibly useful measure to pay attention to and seek to maximize. Organizations with high retention rates likely have a strong foundation of loyal donors. That strong foundation can lead to a consistent pipeline of donors moving from small annual gifts to mid-size, major and eventually principal gifts. Loyal donors, even the ones only making small gifts, are incredibly valuable as planned giving prospects because they have demonstrated continued support and engagement with your organization.
The next recommendation would be to take a deeper dive into different segments of the donor population and explore their retention and reactivation rates. For example, it would be important to understand whether retention rates vary among donors with sporadic giving and donors who have given every year for several years. If Wossamotta U is losing long-time, consistent donors at a higher rate than their sporadic donors, that could signal a problem. Additionally, do alumni have different retention and reactivation rates than parents? Ideally, the university would eventually have enough information to build specific solicitation strategies that are tailored for unique groups of donors.
Final Evaluation
Ultimately, the fundraising at Wossamotta University is “just okay”. They’re growing, and have been for some time, but their retention rates leave much to be desired, and that puts them in a very risky position should their growth ever slow down or even stop. However, a simple shift in strategy towards increasing donor retention could lead to a stronger and healthier donor population that sets Wossamotta U up for long-term success.